Analytical Thinking


To successfully use analytical thinking, it helps to follow a structured approach when resolving a problem or decision making.
The following 4-step model can be used to walk through the process for every problem or every decision.

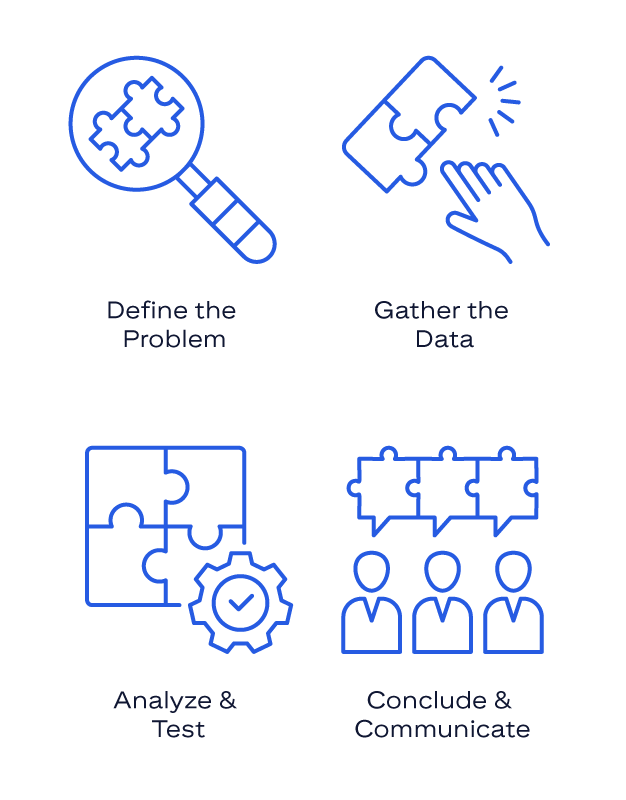
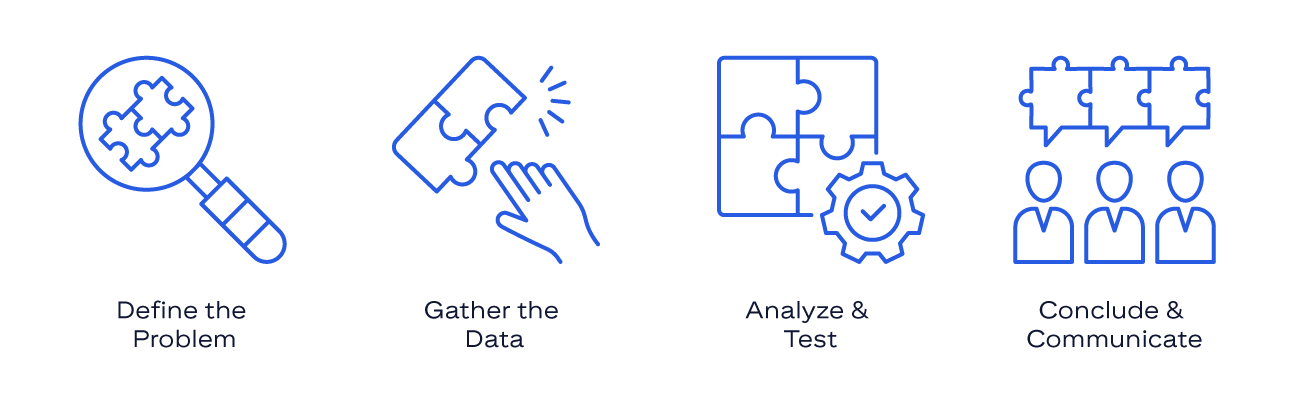
Define the Problem
Gather the Data
Analyze & Test
Conclude & Communicate


Let’s look at how the 4-steps apply in an actual scenario:
A client’s investment portfolio is underperforming compared to its benchmark. It appears that it has been underperforming the market index for three consecutive quarters.
To proceed, select each step to learn more.


Taking our scenario, we need to set out and define the problem. What is discovered isn’t the problem, but it is a symptom. Asking some questions can help reveal the problem.
Some questions to ask include: ‘why is the portfolio underperforming and how can we fix it?’ or ‘How can we improve the portfolio’s performance next quarter?’
Taking our example again, we can now reframe it as: ‘Our client’s portfolio is trailing its benchmark by 3%. We need to determine why this is happening and what action will improve performance while aligning with the client’s goals.’
This explicitly states the gap (3% underperformance) and sets two tasks:
go to next button
With our problem identified the next step is to gather the necessary data.
For our portfolio case, this step involves pulling the portfolio’s details and performance metrics: asset allocation, individual investment returns, risk profile, recent market conditions, fees, any changes in strategy, etc.
You’d also gather the benchmark data for comparison (since underperformance is measured against that).
Remember that any opinions or biases must be kept aside. Just collect information that can help address the question ‘What data and assumptions matter?’.
go to next button
Once you have the information needed it is then ready to be analyzed.
Why?
In the case of our example, we need to determine what could be causing underperformance. Analysis ensures that your strategy still matches your goals. Carefully reviewing the collated information can uncover areas that can reduce risks or enhance returns.
Various tools can be used to analyze why the portfolio is underperforming. Examples of such tools include:
Applying the tools
The possible insight we arrive at after applying the analysis tools may be:
‘The portfolio underperformed largely due to intentional but excessive caution (high cash), a concentrated bet on a faltering sector/stock, and routine fees. These were influenced by biases and a lack of course correction.’
We need to be able to test our thinking as we work through our analysis. For instance, as a “test,” you could calculate:
‘If we had only 5% cash like the benchmark, and if we limited stock A to a smaller weight, what would the return have been?’
If that math shows the portfolio would have matched or beaten the benchmark, it quantitatively validates the causes we identified (cash and stock selection).
go to next button
With our analysis, we can make sense of what has happened. Next, we need to draw conclusions and communicate these thoughts clearly and confidently.
Let’s take our example:
If you find that the portfolio’s weak performance comes from “excessive cash holdings and over-concentration in one sector”, what do you recommend?
You might suggest rebalancing: reducing cash to 5–10%, reinvesting into diversified equities or bonds based on risk profile, and trimming the overweight tech stock from 10% to 5%.
You might also propose a quarterly review process to keep allocations balanced over time.
Each recommendation ties directly to a cause — underinvestment, over-concentration, or process gaps — making it evidence-based.
Context is everything. If the client is highly risk-averse, part of your job is to show why staying entirely in cash can actually increase risk over time, since inflation quietly erodes value. You could show data proving that even a moderate investment strategy could have improved performance.
The goal is to present trade-offs clearly and show that your recommendation is not just logical, but right for them.
go to next button
Now that you have your conclusions, you need to communicate them with the client. Taking the Bottom-Line Up Front method, lead with the conclusion and follow up with your explanation.
For instance:
‘My recommendation is to rebalance the portfolio by reducing cash from 20% to 5%, reinvesting in a diversified equity fund, and cutting XX stock from 10% to 5%. This should improve performance and better manage risk.’
Then explain the rationale:
‘The portfolio underperformed because it held too much cash and was overweight in a declining sector. Redeploying cash and diversifying will help capture more upside while reducing downside risk. Our analysis suggests this could have added roughly +3% to returns, and with quarterly reviews, we’ll prevent similar gaps in the future.’
Present the conclusion, followed by reasoning and evidence. With this structure, busy stakeholders can grasp the key message in seconds and dive deeper if they want more detail. Ensure that any recommendations made connect back to the analysis.


Habit 1: Check Your Assumptions
Assumptions are beliefs we treat as facts, often without proof. Unchecked, they can derail analysis. Critical thinkers surface and test them.
When defining a problem or gathering data, ask:
‘What assumptions am I making?’
List assumptions, then validate or revise them. When you catch yourself thinking ‘X is definitely true’ or ‘We must do Y,’ stop and question it. For instance, a credit officer might assume ‘property prices never fall here.’ That belief proved false in 2008. A critical thinker would ask, ‘What data supports that? What if it isn’t true?’
Each time you pause to test an assumption, you reduce blind spots. Ask: ‘What must be true for this to hold? What are we assuming that, if wrong, changes our conclusion?’
Habit 2: Seek Counter-Evidence
We all have confirmation bias, the tendency to favor data that agrees with us. Once we form a view, such as ‘tech is the issue’ or ‘this client is conservative,’ we filter information accordingly.
To think critically, deliberately look for counter-evidence. Ask yourself ‘How could I be wrong? What would show another explanation?’
In practice:
Search for data that contradicts your theory.
Invite an opposing view:
‘Here’s my conclusion. What’s the counterargument?’
Test alternatives:
‘Maybe fees caused it. What happens if I remove that effect?’
The goal isn’t to make sure you aren’t cherry-picking. If your analysis holds after the challenge, great. If not, adjust. In banking, this habit protects against bad loans and overconfidence. It takes humility, but it always strengthens your judgment.
Habit 3: Think in Probabilities, Not Certainties
Bankers live with uncertainty, since markets, clients, and economies shift constantly. Critical thinkers accept uncertainty and avoid false certainty.
Thinking in probabilities means saying, ‘There’s a high chance X will happen, but Y could too.’ Instead of ‘This will work,’ say, ‘There’s a 75 percent probability it will work, though a 25 percent chance that market conditions could change.’
By quantifying likelihoods, you set realistic expectations and prepare contingencies. For example, in credit decisions, you might say ‘This borrower has a 95 percent likelihood of repayment, with a 5 percent default risk.’ That informs pricing and reserves.
Regulators value this kind of reasoning because it reflects real-world risk. Using words like ‘likely’, ‘unlikely’, or ‘50/50’ changes how you think. You become more flexible, less surprised, and better prepared.
Probability-thinking builds intellectual humility. You recognize you could be wrong and plan accordingly.
Habit 4: Identify the Biases
In Habit 2, we mentioned confirmation bias, the tendency to trust data that fits your view and dismiss what doesn’t. That is only one of many.
Anchoring bias
The anchoring bias makes you cling to an initial number or idea. For example, an analyst might see a stock once priced at $120 and call $90 cheap, ignoring changed conditions.
Availability bias
The availability bias means overvaluing what’s easy to recall. After hearing about fintech collapses, a banker might overestimate the risk of all tech ventures.
Halo effect
The Halo effect is letting one good trait overshadow everything else, such as assuming a company is strong simply because its CEO is impressive.
The best defense is awareness. Use Habits 1 and 2 together to catch these biases early. Keep asking ‘What assumptions am I making? Have I considered the opposite? What’s influencing my view right now?’.
You can also assign a devil’s advocate in team discussions, someone who challenges any assumptions and keeps thinking sharp.


In our portfolio case, if we stopped at ‘the portfolio underperformed because it had too much cash and a bad stock pick,’ we wouldn’t have identified the root cause.
The deeper causes we could find might look like this.
Select each part of the fish to reveal the causes.
The client’s overly cautious mindset and fear of loss, shaped by past market volatility, led to excessive cash holdings.
go to next button
There was no structured quarterly review process to challenge allocations or trigger rebalancing when performance slipped.
go to next button
The portfolio monitoring tools didn’t flag deviations from the benchmark early enough to prompt timely action.
go to next button
Outdated research and market data reinforced conservative assumptions and delayed corrective moves.
go to next button
Together, these reveal a system-level issue: a mix of behavior, process, and feedback gaps that can be addressed through client education and stronger review policies in the future.
Root cause work often identifies small levers that shift big outcomes.
return to this button


Claire has identified a potential problem for an underperforming investment portfolio. She reviewed the portfolio’s details, performance metrics, benchmark data, conducted her analysis and plans to send her evaluation to senior management.
Which of the following questions is NOT an aspect of the 4-step model of analytical thinking that Claire can apply to test her thinking in this scenario?
Select the best response from the five options and then select Submit.
Please only use the tab and shift tab keys to access each option and the Submit button with the keyboard. Then only use the Enter or Space key to select an option or the Submit button with the keyboard. The up and down arrow keys are not fully supported. If the screen reader suggests that you use the arrow keys to change an option, please ignore this. Continue using the tab and shift tab keys and then Enter or Space keys to change an option. If you stop hearing the screen reader use the tab key to reset the focus.
Analytical thinking involves deconstructing complex issues into smaller elements to understand and solve them effectively. The 4-step model consists of the following actions: Define the Problem; Gather the Data; Analyze & Test; then Conclude & Communicate.
Analytical thinking involves deconstructing complex issues into smaller elements to understand and solve them effectively. The 4-step model consists of the following actions: Define the Problem; Gather the Data; Analyze & Test; then Conclude & Communicate.
Analytical thinking involves deconstructing complex issues into smaller elements to understand and solve them effectively. The 4-step model consists of the following actions: Define the Problem; Gather the Data; Analyze & Test; then Conclude & Communicate.
That answer is correct.
Analytical thinking involves deconstructing complex issues into smaller elements to understand and solve them effectively. The 4-step model consists of the following actions: Define the Problem; Gather the Data; Analyze & Test; then Conclude & Communicate.
That answer is not correct.
Refer to the The Core Elements of Analytical Thinking section.
That answer is not correct.
Refer to the The Core Elements of Analytical Thinking section.
Jason conducts an analysis to uncover the root cause of an excess cash allocation in an underperforming portfolio. He uses the 5 Whys method:
1. Why was the portfolio holding 20% cash?
The portfolio management team decided to stay in cash rather than invest more in the market.
2. Why did they decide to stay with 20% cash level?
There was uncertainty about the markets and fear of a downturn.
3. Why was there such uncertainty and fear?
The client experienced the 2020 market crash and was wary of a reoccurrence, despite data reflecting market recovery.
4. Why wasn’t the cash allocation adjusted given the market data?
The portfolio management team had an anchoring bias–they anchored on the assumption that ‘20% cash is prudent’ and failed to update that view as conditions changed.
5. Why did no one revisit this assumption?
There is no process or control to trigger review of cash allocation levels on a recurring basis.
Can you discover the possible root cause from this analysis?
Select the best response from the three options and then select Submit.
Please only use the tab and shift tab keys to access each option and the Submit button with the keyboard. Then only use the Enter or Space key to select an option or the Submit button with the keyboard. The up and down arrow keys are not fully supported. If the screen reader suggests that you use the arrow keys to change an option, please ignore this. Continue using the tab and shift tab keys and then Enter or Space keys to change an option. If you stop hearing the screen reader use the tab key to reset the focus.
By applying the 5 Whys, a technique of Causal Analysis, Jason can delve deeper to identify the fundamental cause of the issue versus just the symptoms.
By applying the 5 Whys, a technique of Causal Analysis, Jason can delve deeper to identify the fundamental cause of the issue versus just the symptoms.
By applying the 5 Whys, a technique of Causal Analysis, Jason can delve deeper to identify the fundamental cause of the issue versus just the symptoms.
That answer is correct.
By applying the 5 Whys, a technique of Causal Analysis, Jason can delve deeper to identify the fundamental cause of the issue versus just the symptoms.
That answer is not correct.
Refer to the Causal Analysis section.
That answer is not correct.
Refer to the Causal Analysis section.
Sydney is analyzing her client’s portfolio performance and decides to apply the MECE (Mutually Exclusive, Collectively Exhaustive) framework to organize potential reasons for underperformance. She creates three categories:
Select the best response from the four options and then select Submit.
Please only use the tab and shift tab keys to access each option and the Submit button with the keyboard. Then only use the Enter or Space key to select an option or the Submit button with the keyboard. The up and down arrow keys are not fully supported. If the screen reader suggests that you use the arrow keys to change an option, please ignore this. Continue using the tab and shift tab keys and then Enter or Space keys to change an option. If you stop hearing the screen reader use the tab key to reset the focus.
Each category represents a distinct type of factor. There is no overlap between these categories, so they are mutually exclusive. Also, these three categories cover all possible reasons for underperformance, with no major reason being outside these categories. Therefore, they are collectively exhaustive.
Each category represents a distinct type of factor. There is no overlap between these categories, so they are mutually exclusive. Also, these three categories cover all possible reasons for underperformance, with no major reason being outside these categories. Therefore, they are collectively exhaustive.
Each category represents a distinct type of factor. There is no overlap between these categories, so they are mutually exclusive. Also, these three categories cover all possible reasons for underperformance, with no major reason being outside these categories. Therefore, they are collectively exhaustive.
That answer is correct.
Each category represents a distinct type of factor. There is no overlap between these categories, so they are mutually exclusive. Also, these three categories cover all possible reasons for underperformance, with no major reason being outside these categories. Therefore, they are collectively exhaustive.
That answer is not correct.
Refer to the Categorization section.
That answer is not correct.
Refer to the Categorization section.
Which statement best reflects the importance of gathering, interpreting, and evaluating data with an open mind and awareness of bias?
Select the best response from the four options and then select Submit.
Please only use the tab and shift tab keys to access each option and the Submit button with the keyboard. Then only use the Enter or Space key to select an option or the Submit button with the keyboard. The up and down arrow keys are not fully supported. If the screen reader suggests that you use the arrow keys to change an option, please ignore this. Continue using the tab and shift tab keys and then Enter or Space keys to change an option. If you stop hearing the screen reader use the tab key to reset the focus.
Being open-minded and aware of bias allows for objective evaluation, leading to more reliable and balanced decisions.
Being open-minded and aware of bias allows for objective evaluation, leading to more reliable and balanced decisions.
Being open-minded and aware of bias allows for objective evaluation, leading to more reliable and balanced decisions.
That answer is correct.
Being open-minded and aware of bias allows for objective evaluation, leading to more reliable and balanced decisions.
That answer is not correct.
Refer to the Collection and Synthesis section.
That answer is not correct.
Refer to the Collection and Synthesis section.
Which of the following is a key component of analytical thinking?
Select the best response from the four options and then select Submit.
Please only use the tab and shift tab keys to access each option and the Submit button with the keyboard. Then only use the Enter or Space key to select an option or the Submit button with the keyboard. The up and down arrow keys are not fully supported. If the screen reader suggests that you use the arrow keys to change an option, please ignore this. Continue using the tab and shift tab keys and then Enter or Space keys to change an option. If you stop hearing the screen reader use the tab key to reset the focus.
Analytical thinking involves deconstructing complex issues into smaller elements to understand and solve them effectively.
Analytical thinking involves deconstructing complex issues into smaller elements to understand and solve them effectively.
Analytical thinking involves deconstructing complex issues into smaller elements to understand and solve them effectively.
That answer is correct.
Analytical thinking involves deconstructing complex issues into smaller elements to understand and solve them effectively.
That answer is not correct.
Refer to the The Core Elements of Analytical Thinking section.
That answer is not correct.
Refer to the The Core Elements of Analytical Thinking section.


go to close menu button
go to close button